 Conceptual visual — no client media
Concept project — no real client

A dashboard that answers the right question before showing a hundred charts.
Conceptual visual — no client media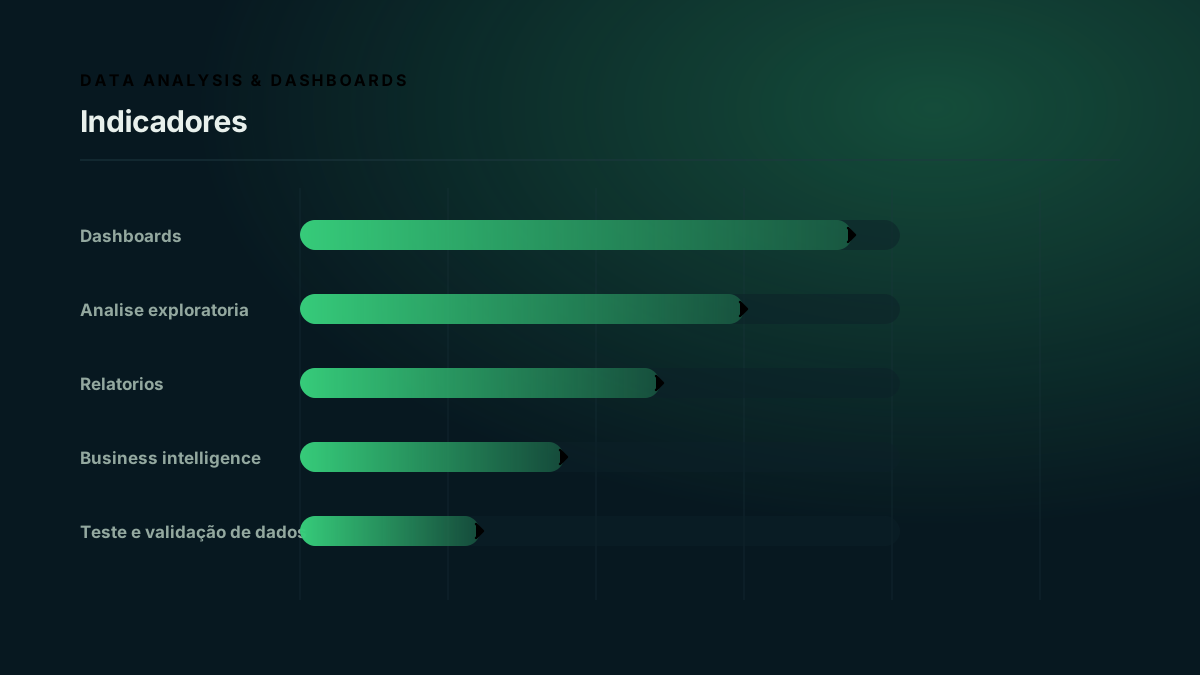

Reports that display more than they explain.
We confirm the expected outcome, inspect the available inputs, expose the main risk and define an observable acceptance criterion before expanding scope.
A dashboard tied to real questions, decisions and sources.
Send the outcome, deadline and what already exists. We will reply with the smallest useful first step.
Discuss this project →